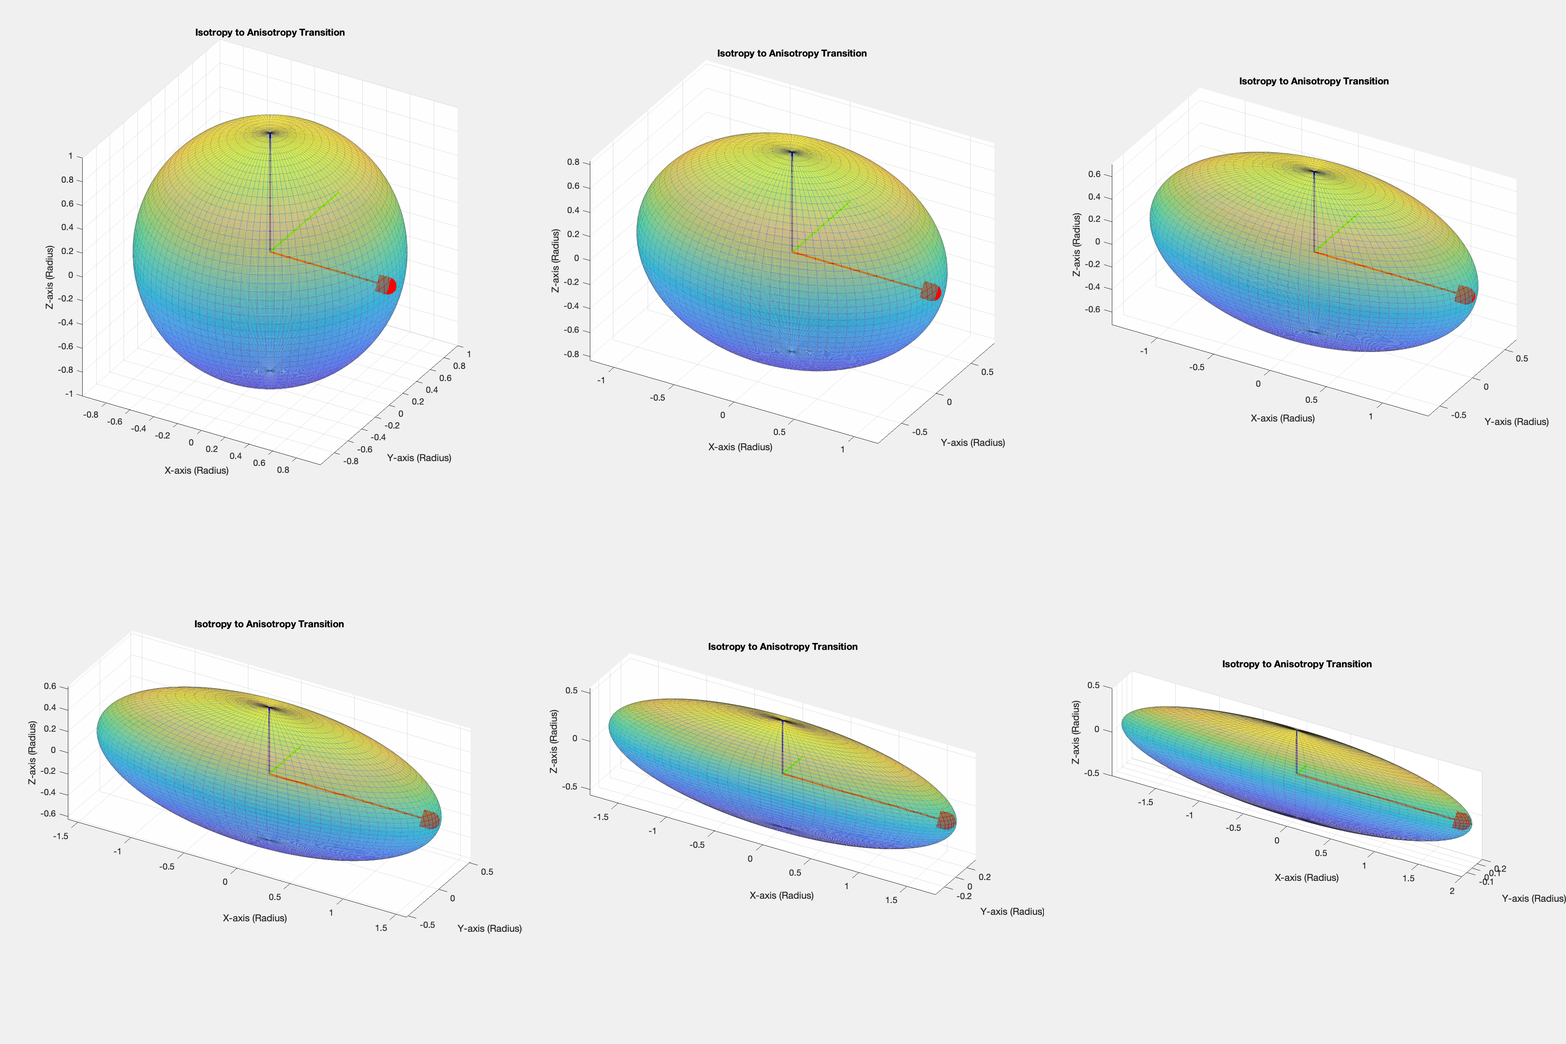
I usually enjoy creating drawings. Here are some trivial plots I’ve made using R or MATLAB. 😂😂😂
it’s quite satisfying to create beautiful plots.
Here are some of the plots I’ve made; some of them are just random “doodles”


Using deep learning for plant species identification has always been a personal area of interest for me. By introducing a public dataset containing images of flowers from 102 plant species and applying transfer learning with the GoogLeNet (Inceptionv3) convolutional neural network (CNN) to extract features from the flower images, the results demonstrated that the classification accuracy for 4,070 photos could exceed 89%.
I used the Gradient-weighted Class Activation Mapping (Grad-CAM) method to understand the reasons behind GoogLeNet’s classification decisions for flowers. For orchids, it was revealed that the column and lateral petals are the primary factors influencing classification. However, it was also evident that GoogLeNet struggled to recognize other objects in images containing multiple objects (middle image). Recognizing multiple targets within a single frame is another area of interest for me.

Here’s a Christmas tree I drew using R. I know it looks pretty terrible, like a doodle from a child who hasn’t learned how to write yet, but anyway, I want to wish everyone a Merry Christmas!
P.S. I’ll find time to fix this image later. After all, even kindergarten doodles can grow up one day!


